What the numbers mean
Analytics shows how your posts did across every connected account, day by day, and how often the numbers update.
The Analytics page
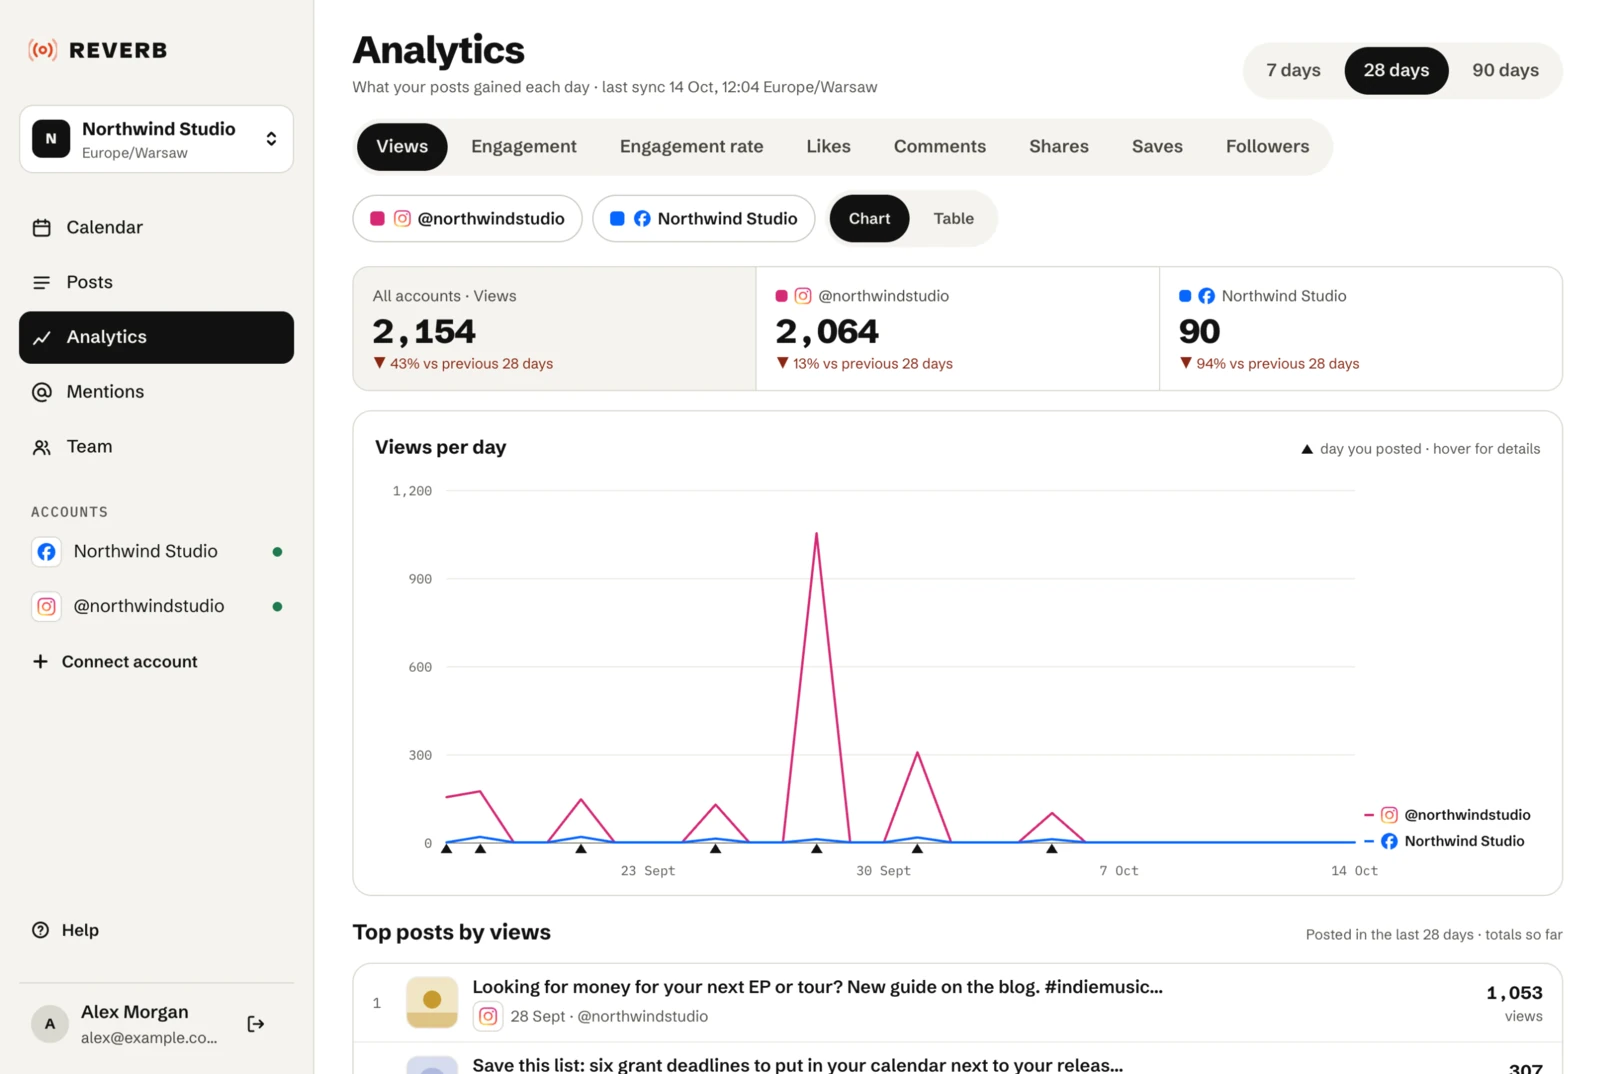
- Pick the last 7, 28 or 90 days. Each range is compared with the same number of days before it.
- Each account has its own line on the chart, with the days you posted marked. A table view shows the same numbers.
- You also see totals per account against the previous period, the top posts of the period, and a small chart of every metric per account.
- Posts published through REVERB and posts made directly in the apps both count.
Metrics
- Views, likes, comments, shares, saves: as the platform reports them. On Facebook, likes include all reactions.
- Engagement: likes, comments, shares and saves added up.
- Engagement rate: engagement as a share of views.
- Followers: one count per account per day.
A day’s number is what your posts gained that day. Whatever a post got before REVERB first saw its stats counts on the day it was posted.
How fresh the numbers are
- Stats of posts from the last week refresh every few hours. Older posts, up to 90 days back, refresh about once a day.
- Numbers can lag behind the apps by a few hours. Views of very fresh posts may show as “not collected yet” for a short while.
- Days in Analytics are UTC days, not your team’s timezone.
Gaps and missing numbers
- Facebook doesn’t report saves.
- When an account’s connection is lost, its chart shows a gap marked “not synced” instead of zeros. See Reconnecting an account.
- TikTok and YouTube don’t report reach or saves. For TikTok, only public videos have stats.